Showing posts with label MLB. Show all posts

Saturday, November 2, 2013

MLB Post-Season Wrap-up

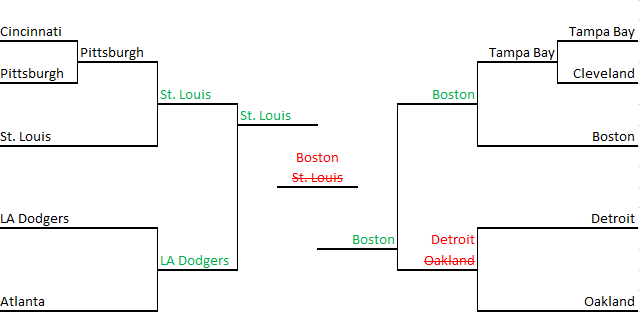
Below I have posted the results of the MLB playoffs. My picks, based solely on my MLB rankings, are compared to the results. Overall, my rankings did a fairly decent job of predicting the outcomes. Correct picks are in green, incorrect picks in red. I successfully picks the World Series match-up. Andy while I had St. Louis winning the championship in 7, Boston actually won in 6. The World Series and the AL Divisional Series between Detroit and Oakland were the only series that I missed.


The World Series had a few unique game ending moments. One in particular was the first ever walk-off obstruction call in World Series history. If you missed the play, you can see the video here and see/read the rule explained here. I'd like to get your take on the play and the call. Was the right call made? In my opinion, yes. The way I interpret the rule, the intent of the obstructing player does not matter. The two questions are: Does he have the ball? Is he impeding the runner? If he doesn't have the ball and he is impeding the runner, that is interference. (A side note: I believe there was intent to interfere as well. If you watch the video, you will see the third baseman's legs raise in the air as the runner tries to jump over his hip area.).

Right call? Wrong call? I'd like to hear your thoughts. Although, in the grand scheme of the Series, that game couldn't slow down Big Papi and the Red Sox, who clinched their third World Series Championship in a decade.

Friday, October 4, 2013

Final 2013 MLB Regular Season Rankings

Final Rankings
Below is a snapshot of the Top 15 MLB teams for the 2013 regular season. The full rankings can be seen on the MLB Rankings tab of this blog. The delta ratings and W/L are calculated from 8 Sep, so you can see the change in performance over the last three weeks of the season. The teams that made the playoffs for the AL and NL are colored in blue and red, respectively. The teams that are underlined won their division. If you are unfamiliar with my MLB rating system, check out this post for an explanation.


St. Louis and Boston tied for the best records in baseball, but the Cardinals edged out the Red Sox for the top spot in the final standings by a half point. The Dodgers finally cooled off during the last three weeks of the season, dropping below a rating of 100 and into third place. Cleveland finished the regular season on a 10-game winning streak, and winning 16 out of their last 20, shoot up to fifth place. The Redlegs did not finish the season well, dropping to 9th place and having the second worst delta rating of the entire league in the last three weeks of the season.

An interesting note is that the top 10 teams in my rankings correspond to the ten teams that made the playoffs. Does that give some credence to my rankings? Perhaps. However, I think it speaks more to the marathon baseball season truly getting the best teams from each league in the playoffs. Also, it just so happened to work out that the top 5 teams in each league were among the top 10 overall. For example, look at spots 10 and 11. Washington (NL) was six-hundredths of a point from cracking the top 10 instead of Detroit (AL). Despite that though, my rankings would have picks the top 5 from each league making the playoffs. Had Washington been ranked above Detroit in the final standings, it would have been irrelevant because Washington (NL) and Detroit (AL) are not competing for the same playoff spot being in different leagues.


Post-Season Predictions
I'm going to strictly use my final predictions pick the results of the post-season. At the time of writing this post, the one-game playoffs have already been played, so I will not predict those games. Instead, I will compare what my ratings would have projected.

My predictions, based entirely on my final rankings, are shown below in blue. Quickly reviewing the 1-game series, my rankings would have correctly picked Pittsburgh, but incorrectly picked Cleveland to advance. I won't lose too much sleep over that, as you will tend to find more anomalies in a smaller sample size (one-game series). I have the Cardinal and Dodgers in the NLCS, and the Red Sox and the A's in the ACLS, with St. Louis over Boston in the World Series.


I'll make things a bit more interesting by taking things a step further... I will also predict the number of games each series will take based on the separation of the teams' rankings. This will be completely arbitrary because I have no basis of history for this, but we'll see if a can't make myself look more like an idiot. Also, the underdog having its ace on the mound in a playoff environment (not to mention playing at least one game at home) can really skew things, but I will not take that into account, just looking at the number only!

Division Series (best of 5):
St. Louis over Pittsburgh in 4, LA over Atlanta in 5, Boston over Tampa Bay in 3, Oakland over Detroit in 3

League Championships (best of 7):
St. Louis over LA in 5, Boston over Oakland in 6

World Series (best of 7):
St. Louis over Boston in 7


Most Likely Upsets
Okay, up to this point, my predictions have been based entire on my final ratings. Ratings aren't prefect. In fact, they are a reflection of previous performance, not predictors of future events. We like to use past performance to predict future outcomes, but upsets do occur. That's why we play the games. So let's take a few moments to look at potential upsets:

AL
  • Tampa Bay is hot! They are have 4 straight road elimination games. I would not be surprised to see TB play Boston pretty tough.
  • If we see an Oakland vs Boston in the ALCS, Oakland could upset Boston. The teams split the season series this year 3-3, and the A's finished the year on a positive note, winning 7 of their last 10.
NL
  • I would strongly consider picking Atlanta over LA, especially given that the Braves will have home field advantage. Also, Atlanta won the season series 5-2 against the Dodgers.
  • I believe the NCLS will be close, whoever plays St. Louis between ATL and LA. Both teams hold a 4-3 season series edge over the Cardinals, but I still expect the Cardinals to win... but I wouldn't be surprised if they didn't.


Friday, August 2, 2013

Introducing Michael's MLB Rankings


Check out the MLB rankings here, or click the "MLB Rankings" tab at the top of this blog.

Behind the Rankings
I don't want to get too in depth here into the details of the mathematics behind the ratings. So, I'll keep it relatively simple in this blog, and refer you to a reference where you can dig into it more if you'd like. I use a slightly modified version of Microsoft's TrueSkill ratings system. Why slightly modified? Two reasons: 1) Microsoft wouldn't elaborate on the complex details of competitions involving three or more competitors. 2) Microsoft would give the specific equations of the 'v' and 'w' functions (check the details in the reference if you care), so I had to curve fit.
 
Issue #2 isn't that big of a detail, my curve fit matches extremely close to their 'v' and 'w' function plots. Issue #1 doesn't effect head-to-head competitions, which cover the vast majority of sporting events, so this does not apply to my MLB rankings. For the curious readers out there, I devised a fairly accurate way of simulating their complex methods of three or more competitor events that tracks very closely with their results. With all that said, I'm satisfied with my Matlab version of the TrueSkill Rating system.
 
I think we can all agree that a team isn't always as good or as bad as their record. Strength of schedule matters. A team can have some very quality wins against a strong opponent, or an embarrassing loss against a poor opponent. From a 30,000 ft view, my MLB ratings (again, based on Microsoft's TrueSkill) measures each team based on the quality of opponent they compete against by tracking two parameters for each team: average skill (mu) and a measure of uncertainty of that skill (sigma). Many rating systems only track the "skill" term. By tracking both skill and uncertainty, you can converge to a more accurate representation of a player's (or team's) skill, with a smaller sample size. A team's opponent's skill, uncertainty, and outcome of the event effect that team's recalculated skill and uncertainty. The rating is generated from subtracting three times the uncertainty from the average skill (rating = mu - 3*sigma). This results in a 99% confidence that the team's skill is at or above that rating.
 
More details here if you are interested! Microsoft TrueSkill Rating
I'd also be happy to answer questions if you'd rather have someone translate that for you: Post your questions via email or comments on this post and I'll get back to you.
 
Current Rankings
(Note: This reflection of the current rankings is based on the posted rankings as of 29 July)
Check out the MLB rankings here, or click the "MLB Rankings" tab at the top of this blog.
 
Tampa Bay, Pittsburgh, LA Dodgers, Boston, and Oakland are in the top 5 of my rankings as of 29 July 2013. The Dodgers have made a steady climb in the rankings in the last month. They have turned their season around remarkably. In the past 30 games, they have gone through a 7 game swing from the Arizona Diamondbacks to take the lead in the NL West. I have a pretty nifty post processing script that allows me to compare ratings and W-L record from any point that I have saved in the season. For the 29 July rankings, the deltas are calculated from the All-Star break, as noted at the top of the rankings. The Rays and Dodgers both have gone 9-2 since the break, while charging up my rankings. Pittsburgh dropped from the #1 spot to second while maintaining 6-6 record since the ASG.
 
A couple things to note to help you get acquainted with my rating system. Let's look at the Yankees and Diamondbacks:
 
13          NY Yankees( 55- 50)90.33(  4-  7)-0.85
14             Arizona( 54- 51)89.84(  4-  7)-2.07

Both teams went 4-7 since 13 July, but New York only dropped -0.85 points in the ratings while Arizona dropped -2.07. Why is this? Again, this reflects the quality of opponents the Yankees and Diamondbacks beat and lost to during that span. The majority of the Yankees losses since the break came to Tampa Bay (currently #1) and Boston (currently #4), while the majority of Arizona's losses came at the hands of the Giants (#27), Cubs (#16), and Padres (#19). Also note, the few wins that the Yankees and Diamondbacks racked up during those games came from the same teams mentioned above. See the difference? The Yankees are being rewarded more and punished less for their wins and losses against their stronger competition.
 
As another side note, it can be tough at the top. With the highest rating, a team is expected to win most of its games. This is why Pittsburgh slid a bit while going .500. Winning half your games will not keep you at the top for very long.
 
2          Pittsburgh( 62- 42)97.96(  6-  6)-1.49

 
If you notice any errors in the W-L record as of a specific date, please let me know. I found two errors already on ESPN (which I just copy and paste into my rating system) that I tracked down.

Friday, July 19, 2013

Tweaking MLB's All-Star Game

The Mid-Summer Classic has come and gone, but with it has come a lot of debate about the baseball All-Star Game (ASG), such as who should be in it and what it should mean for the winning side. I'll tackle both of these questions by proposing what many would consider a radical idea!

MLB All-Star Game

The ASG as we know it today is comprised of 35-40 man rosters. Each team must be represented by at least one player. Also contributing to the inflation of the rosters are ineligible pitchers (due to pitching 3 days prior to the All-Star Game), which must be replaced. And, since that infamous tie in 2002, the winning league of the ASG is rewarded with home field advantage in the World Series.
The biggest problem with the All-Star Game as it is currently constituted is the fact that it is caught between being a fun, whimsical exhibition, and a game with a lot on the line. The fun exhibition aspect is the huge rosters that must include at least one player from every team. The starters come to the plate one or two times before the parade of players begins. On the other hand, home field advantage for the World Series hangs in the balance while the first-team All-Stars are riding the pine during the last half of the game. If Baseball would settle on what it wanted in an all-star game, perhaps it wouldn't seem like such a dichotomy and draw so much attention for a need to change. But for now, it is what it is, and I'll gladly contribute my two cents toward MLB All-Star Game reformation:
I love the fact that the World Series home field advantage is riding on the ASG. Therefore, my suggested changes are centric to this idea. (By the way, as a side note, the reason why I like the ASG determining home field advantage is because no other fair alternative exists. MLB play unbalanced schedules within their own divisions, let alone leagues. Each league's wildcard is somewhat affected by this. Bottom line, there just aren't enough crossover games from league to league to fairly compare season records). I solve Baseball's all-star dilemma in two easy steps:
  • Step One: Trim the roster down to 25. Continue to let the fans choose the starters and the previous year's WS managers fill the remaining rosters out. The MLB can continue to allow the last (25th) man voted in by the fans if they wish.  End the parade of players in the ASG and allow the managers to manage for a win, not to make everyone happy. Also, if a team can make it in the playoffs with a 25 man roster, then an All-Star team can compete in a short series with 25 men as well. Wait... a short series?
  • Step Two: Turn the All-Star Game into a best-of-three All-Star Series. I understand that this seems like a radical change. The baseball season is already too long by the opinions of many, so why extend it any further? Most of the MLB players will be watching the All-Star festivities from their couches, so this actually gives them a bit of a welcomed break halfway through the marathon season. Those fortunate enough to be selected should welcome the opportunity to play in an All-Star Series to determine which league will have home field advantage in the World Series. Also, this solves the problem of pitchers pitching too close to the All-Star Game to be eligible to participate. Based on my All-Star Series schedule (see below), anyone pitching in the last game prior to the break would be able to pitch in Game 3, and therefore would not need to be replaced. And who couldn't resist MLB's All-Stars for at least a two, possibly three, game series!
All-Star Series Schedule
Sat - Last first half game played
Sun - Off, travel
Mon - HR derby
Tues - G1
Wed - G2
Thur - G3 (if necessary)
Fri - Off, travel
Sat - First game of 2nd half played

(Posted from Great Anerican Ball Park)